
The Many Faces of Summer-Dry
Share This!

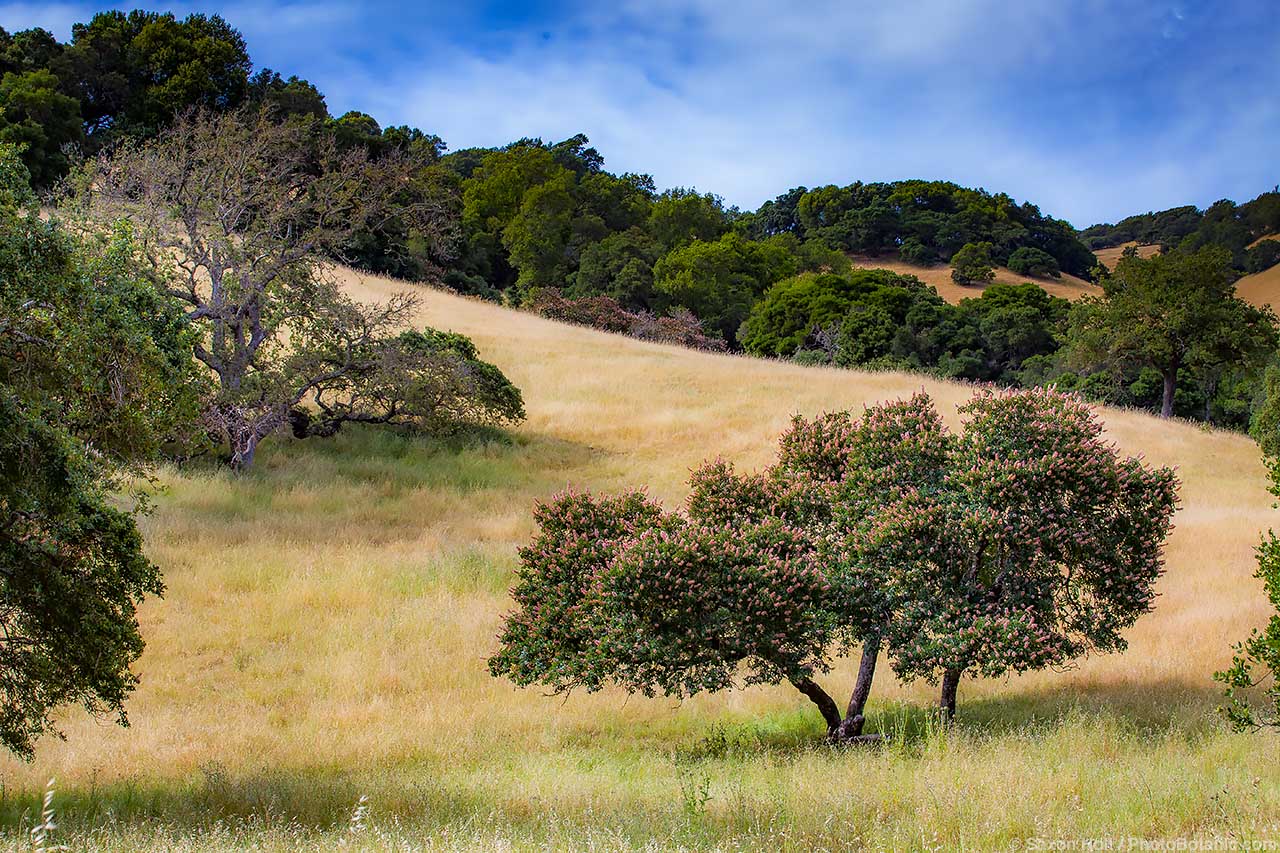
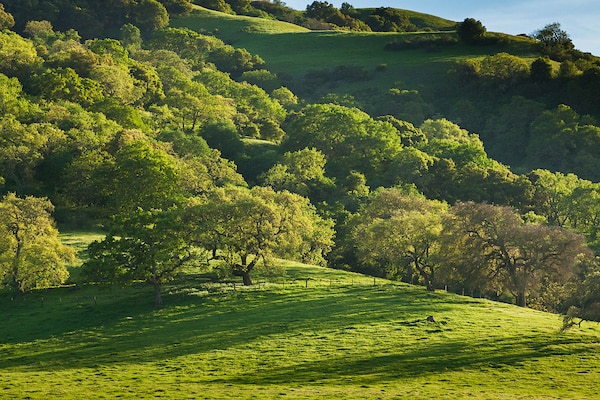
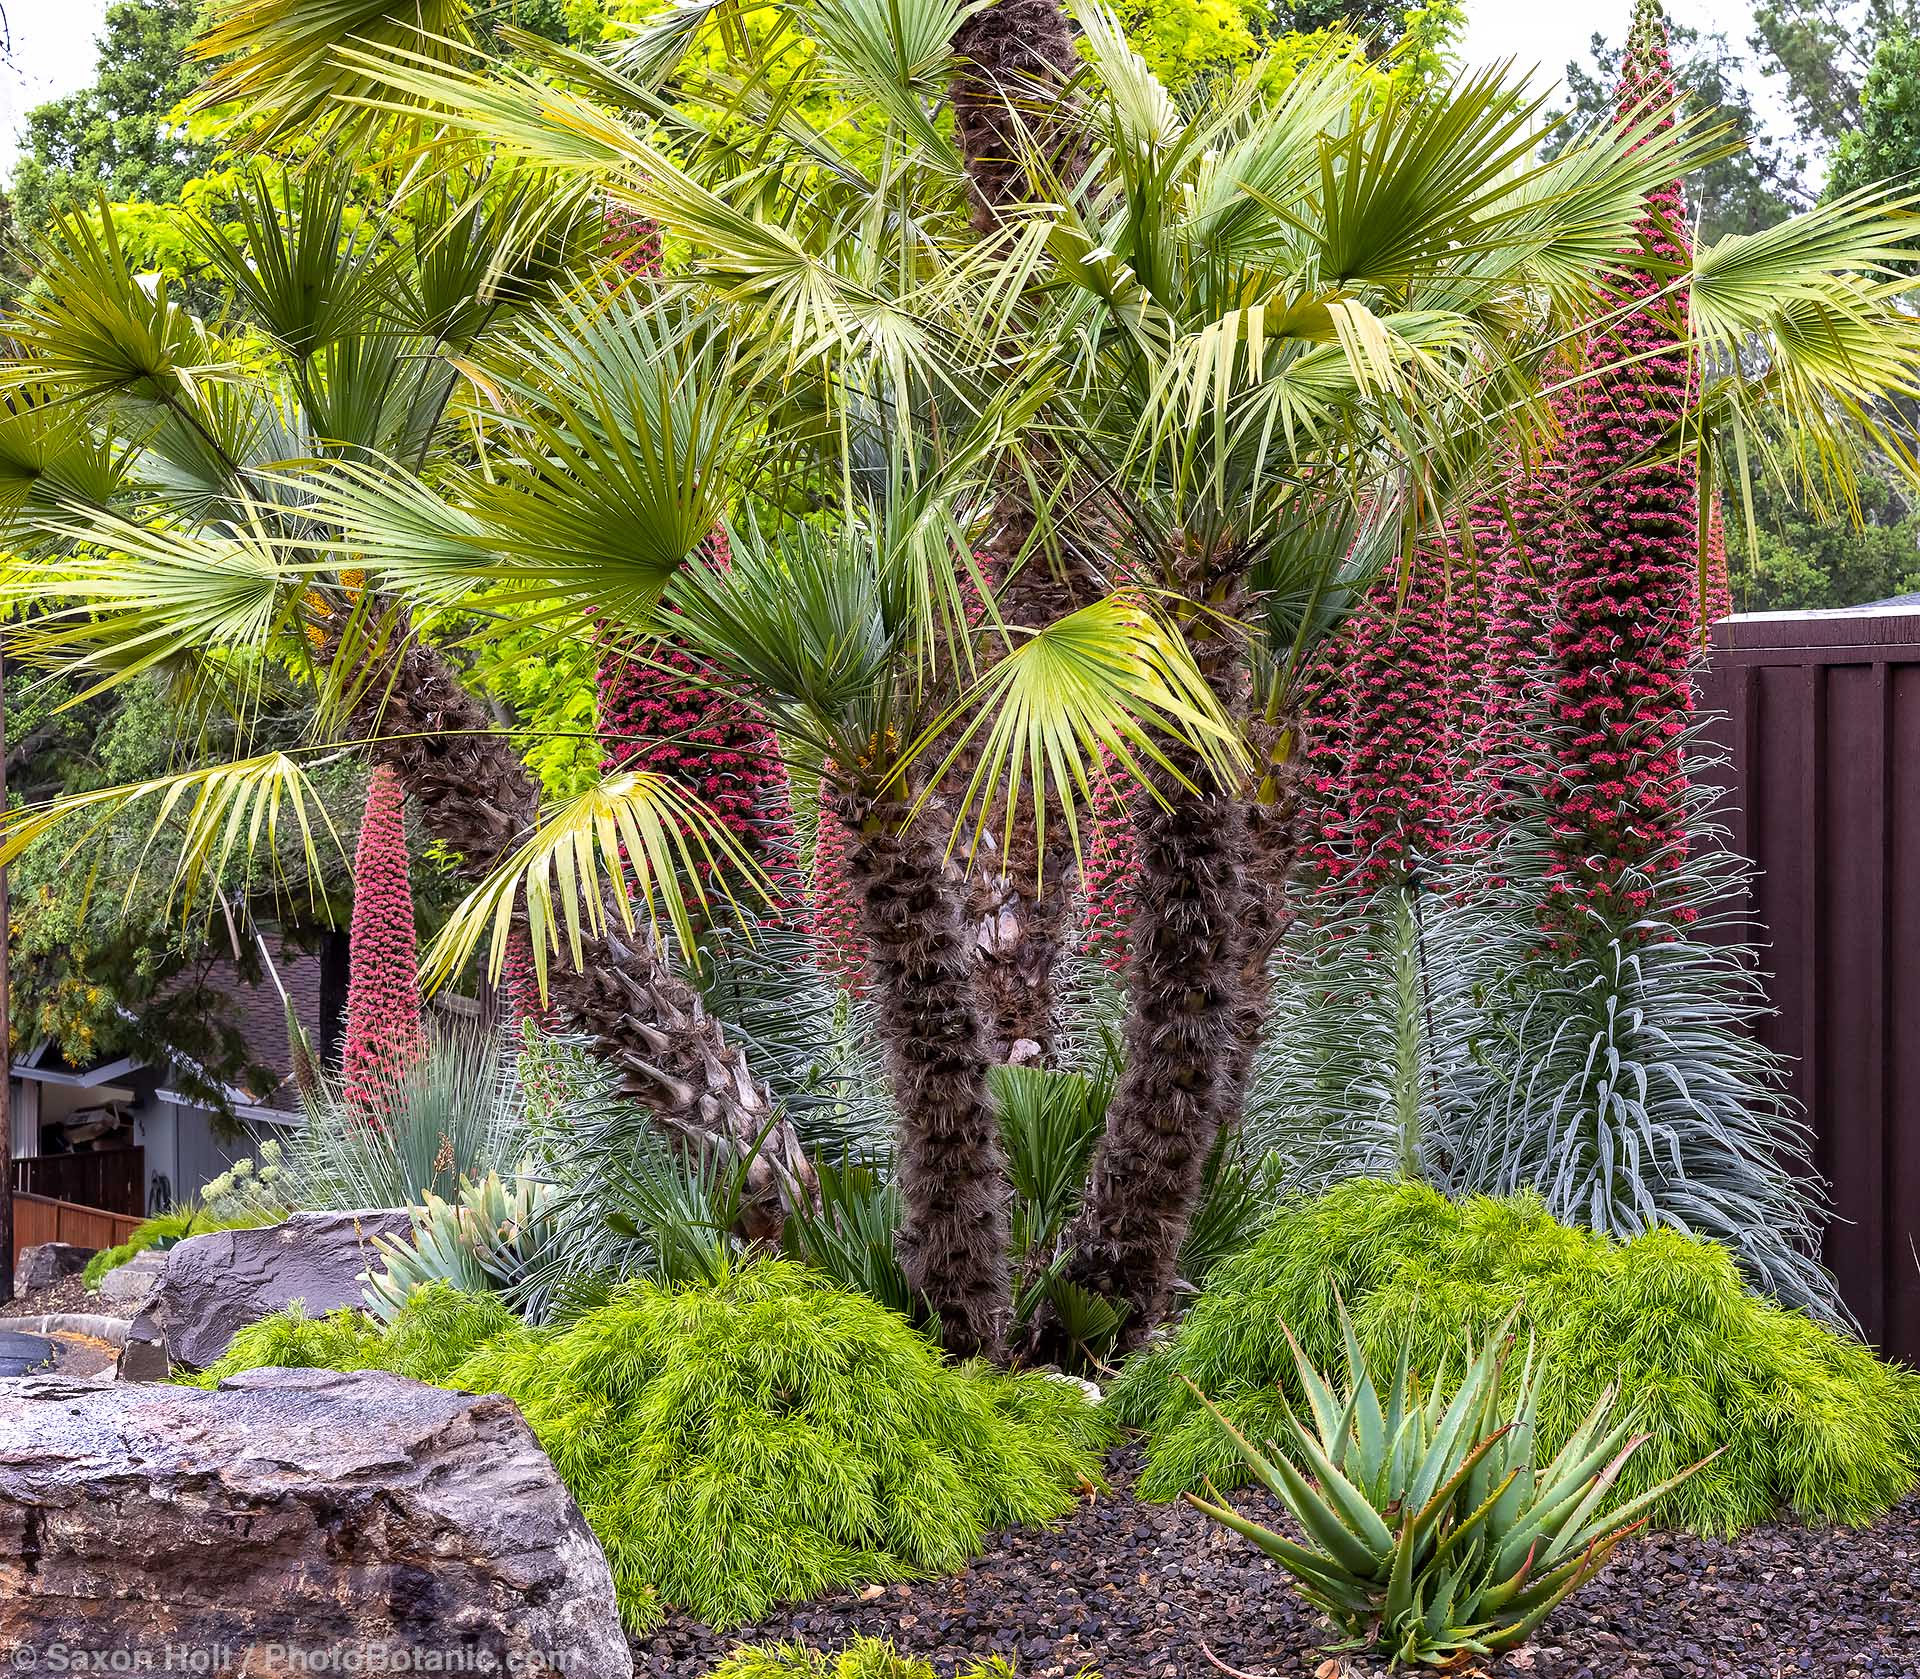
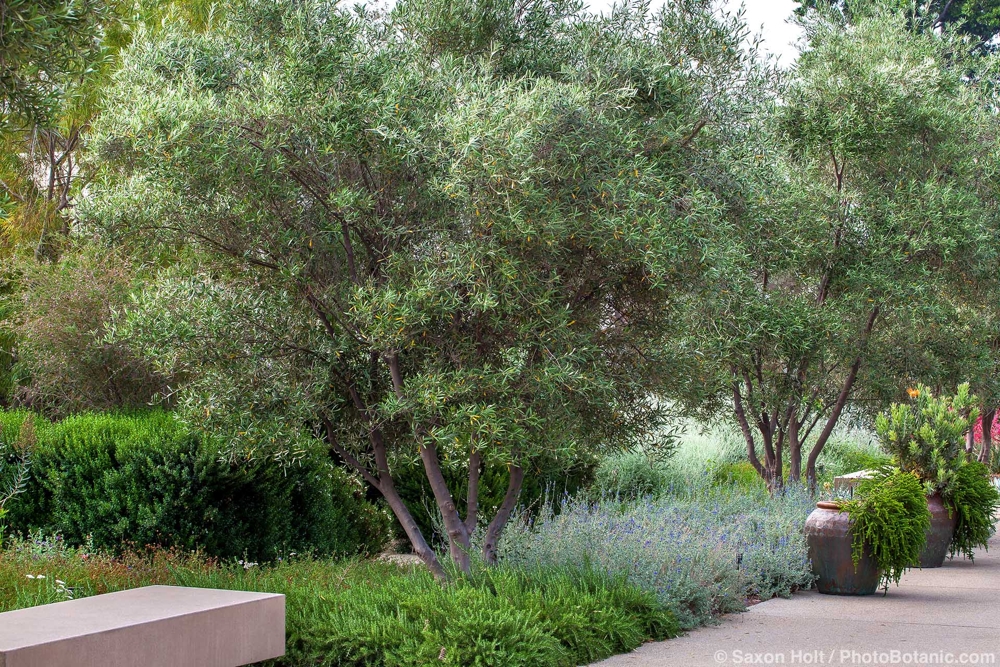
Summer-dry climates are not dry climates. They are climates where rain falls mostly in winter. This is not a common arrangement. In most of the world, rain falls in summer or is fairly well distributed year round. Summer-dry climates are usually found on the west coasts of continents in the mid-latitudes where seasonally shifting atmospheric pressure cells block or open up to the jet stream and its storms. The photo above shows a coastal northern California climate in summer. The photo below shows a similar coastal northern California climate in winter or spring.
Summer-dry climates vary considerably from one place to another and from one year to another in the same place. At the very least they differ in average and extreme summer and winter temperatures, average humidity, average annual rainfall, and distribution of rain throughout the year.
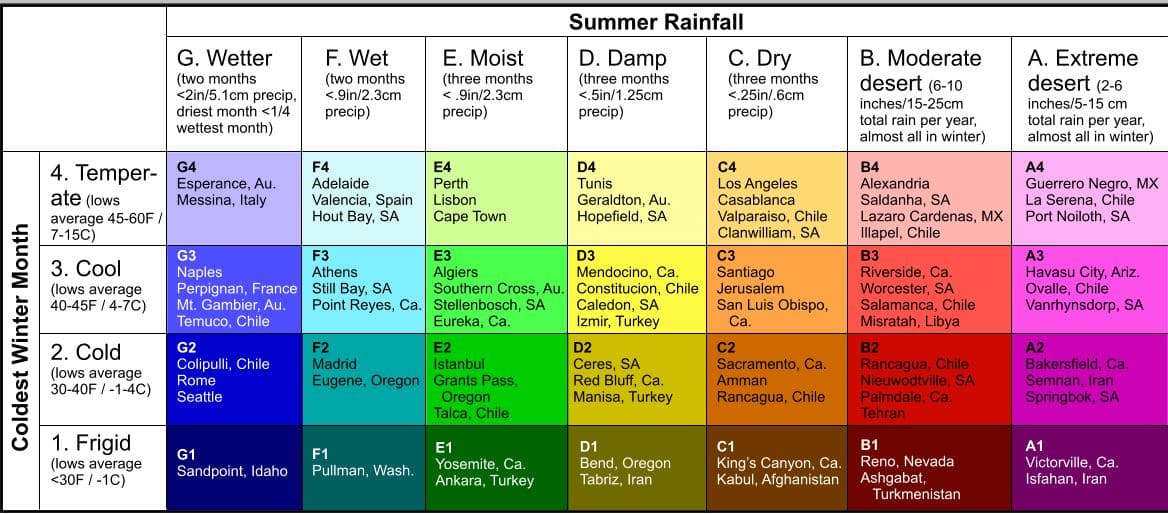
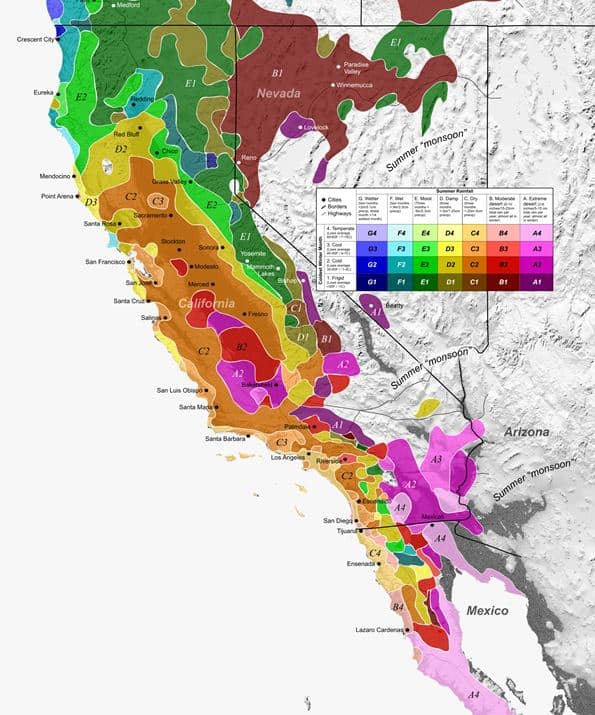
On the website of the Pacific Bulb Society, Lee Poulsen graphically illustrates the similarities and differences among summer-dry climates in regions of the world where bulbs are native. He divides climates into 28 summer-dry zones based on average low temperature in winter and average amount of summer rainfall. The different colors in the chart below show how varied summer-dry climates can be.
Poulsen has created maps using the same color scheme. His maps for both California and the Pacific Northwest show the complex climate effects of latitude, proximity to the ocean, and the coastal and interior mountain ranges. 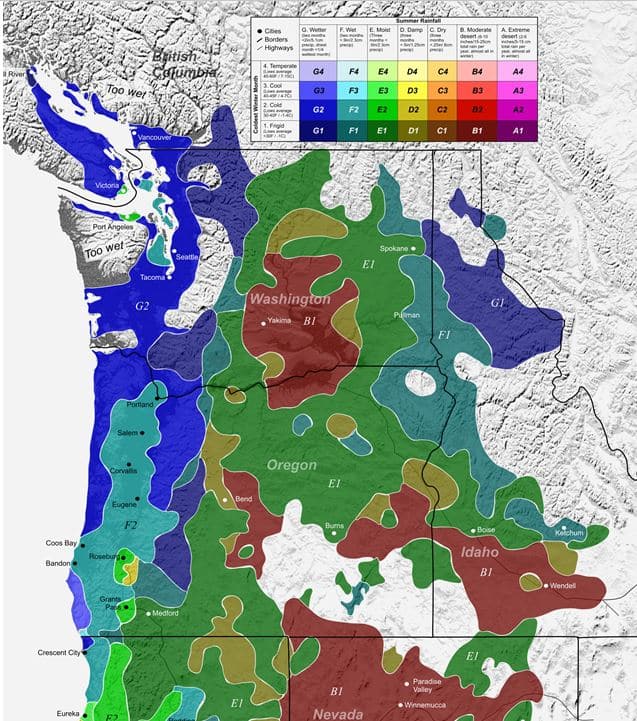
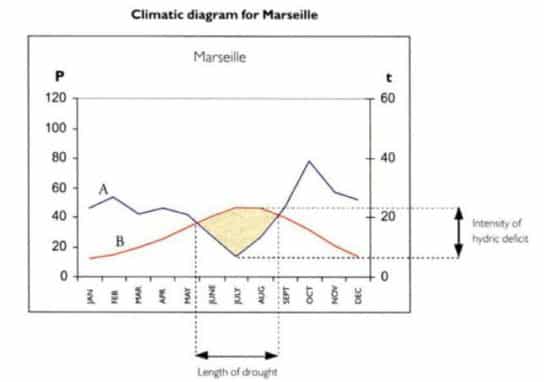
Another way to compare and contrast summer-dry climates is with graphs that depict the relationship between temperature and rainfall throughout an average year. Below is a graph from The Dry Gardening Handbook by Olivier Filippi that shows these data for the city of Marseille, France.
The red line depicts temperature and the blue line precipitation. Where the lines cross is the point at which a plant not adapted to the climate begins to suffer physiological drought (wilting, leaf drop, even death) because evapotranspiration exceeds the water available to plant roots. The distance between the two points shows the length of the summer drought and the area within shows its varying intensity.
The graphs below, from the Climate-Data.org website, show these same data for Vancouver, Canada, and Los Angeles. The climate of Vancouver is usually considered oceanic or west coast maritime and Los Angeles is considered mediterranean or semi-arid, but both show a clear winter-rainfall pattern. The differences in timing and intensity of the summer drought are striking.
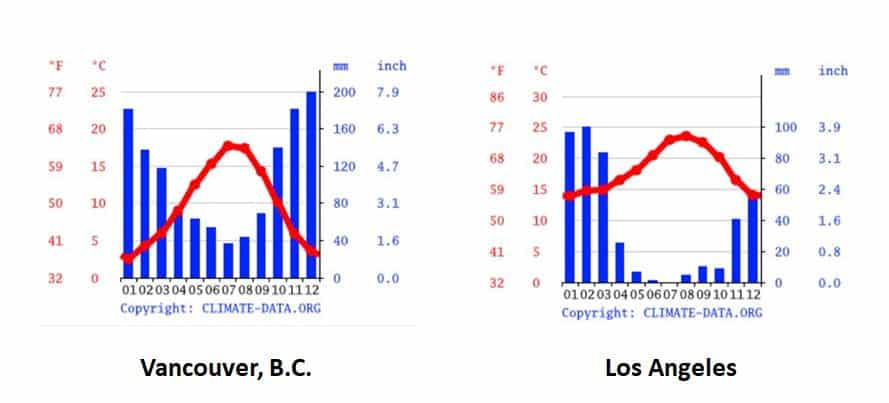
Climate graphs are commonly available on the internet, and they can be used to roughly compare your own climate with that of many other cities worldwide. If you can’t find a climate graph for your city or one nearby, you can create your own with thirty-year temperature and precipitation data from the National Oceanic and Atmospheric Administration’s National Centers for Environmental Education (www.ncei.noaa.gov). The vertical axes of the chart should depict monthly averages for precipitation in millimeters and temperature in degrees Celsius with the scale for precipitation twice that for temperature.

Share This!
2 Comments
Leave A Comment
Related Articles

By: Saxon Holt

By: Saxon Holt

By: Nora Harlow

Its great to have this scientific background and maps. Thanks
Thanks Jack, check out the Pacific Bulb Society website for a detailed discussion of summer-dry climates worldwide.
Nora